Content Insights
Every entry measured. Every suggestion backed by data.
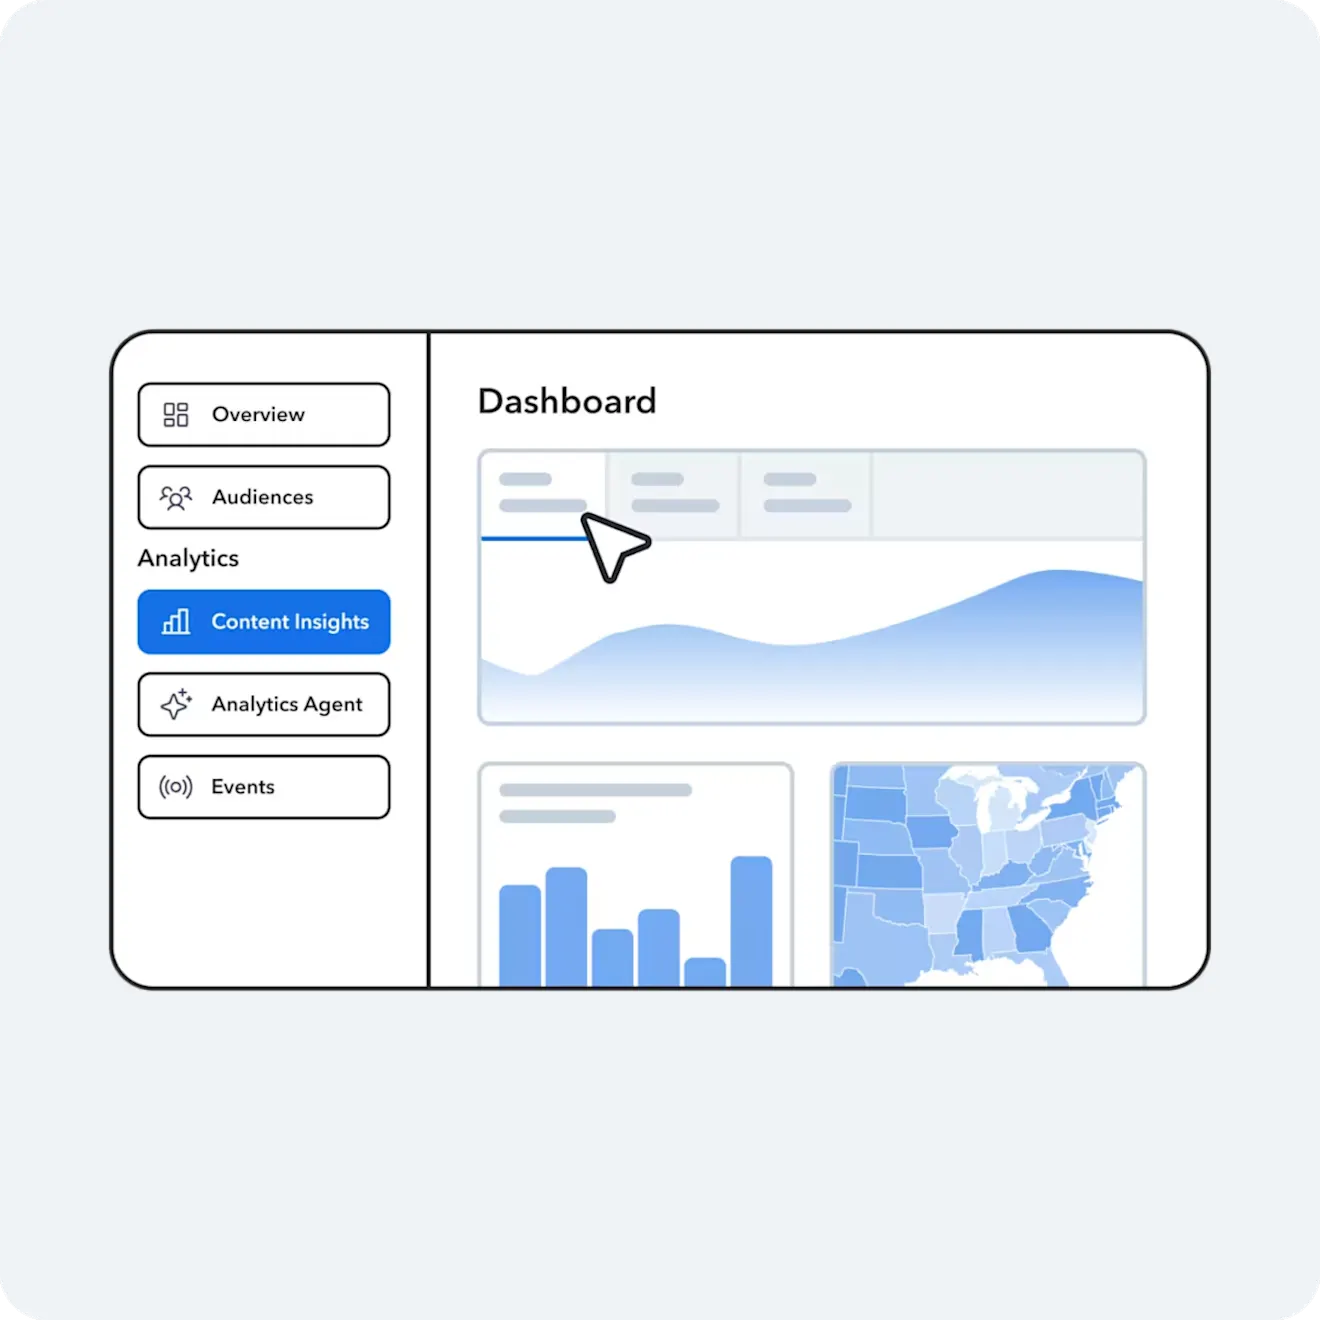
Know what’s working, down to the entry
Sweat the small stuff
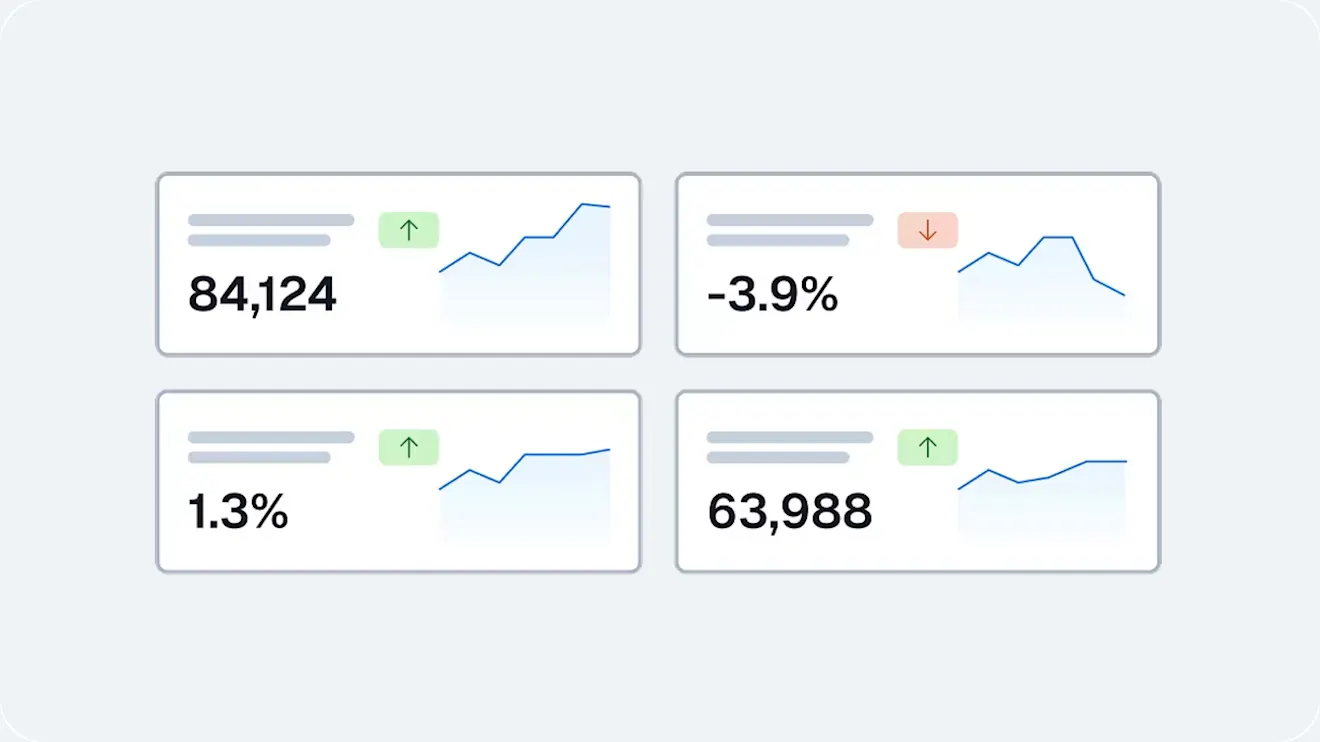
Page-level averages don’t tell the real story. See performance insights down to the entry, banner, or CTA.
Stop tool hopping
Compare content and campaigns across brands, regions, and channels right in Contentful, without stitching together disparate data.
Ask and act
Contentful’s Optimization Agent answers your question and recommends next steps so you can pivot and publish fast.
Replace manual analysis with seamless analytics workflows
Turn your data into personalized content
Page-level averages hide the real story. Content Insights show you which parts of your landing page are performing best and the audiences with the highest engagement.
Track performance of individual entries and components
Use AI to refresh content and tailor it to specific audiences
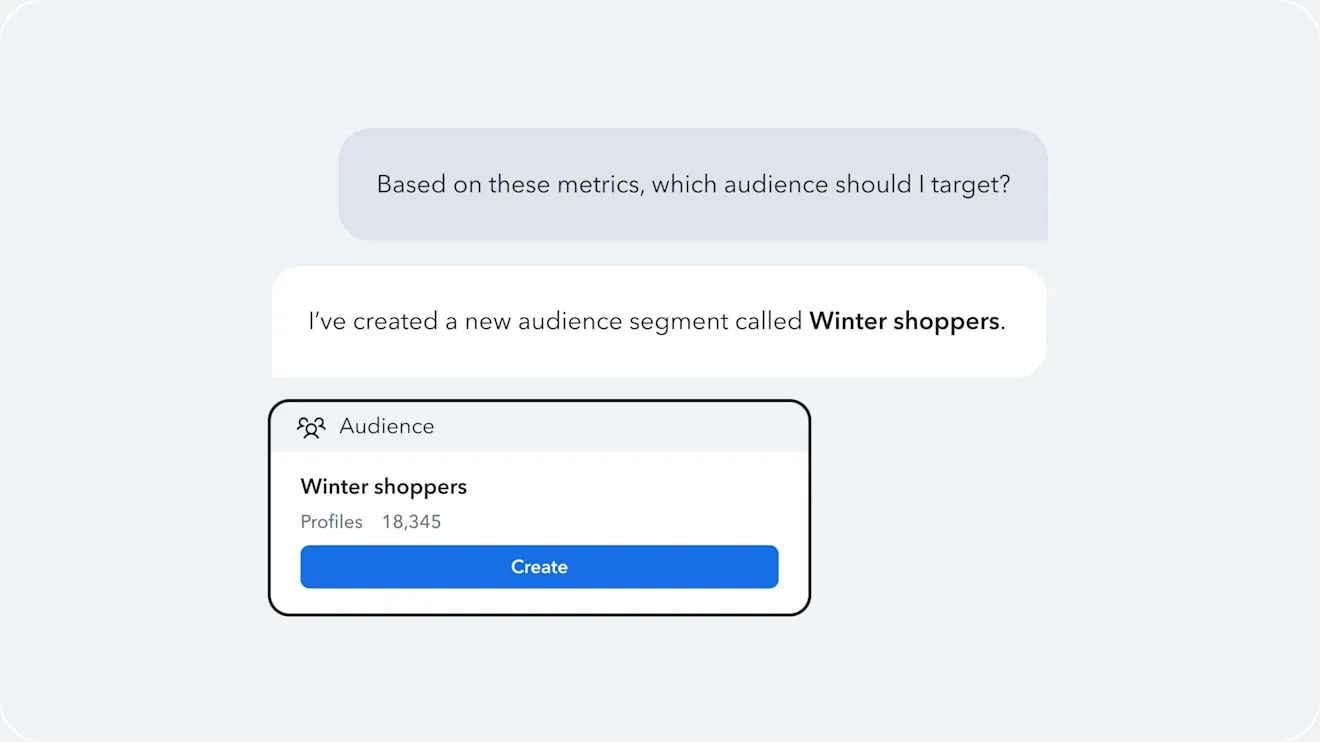
Get instant answers
Skip the BI ticket. Ask the Optimization Agent a plain-English question and get an answer, complete with contextual data and next steps.
See responses in seconds, with no SQL or dashboard required
Turn each answer into your next audience or personalized experience
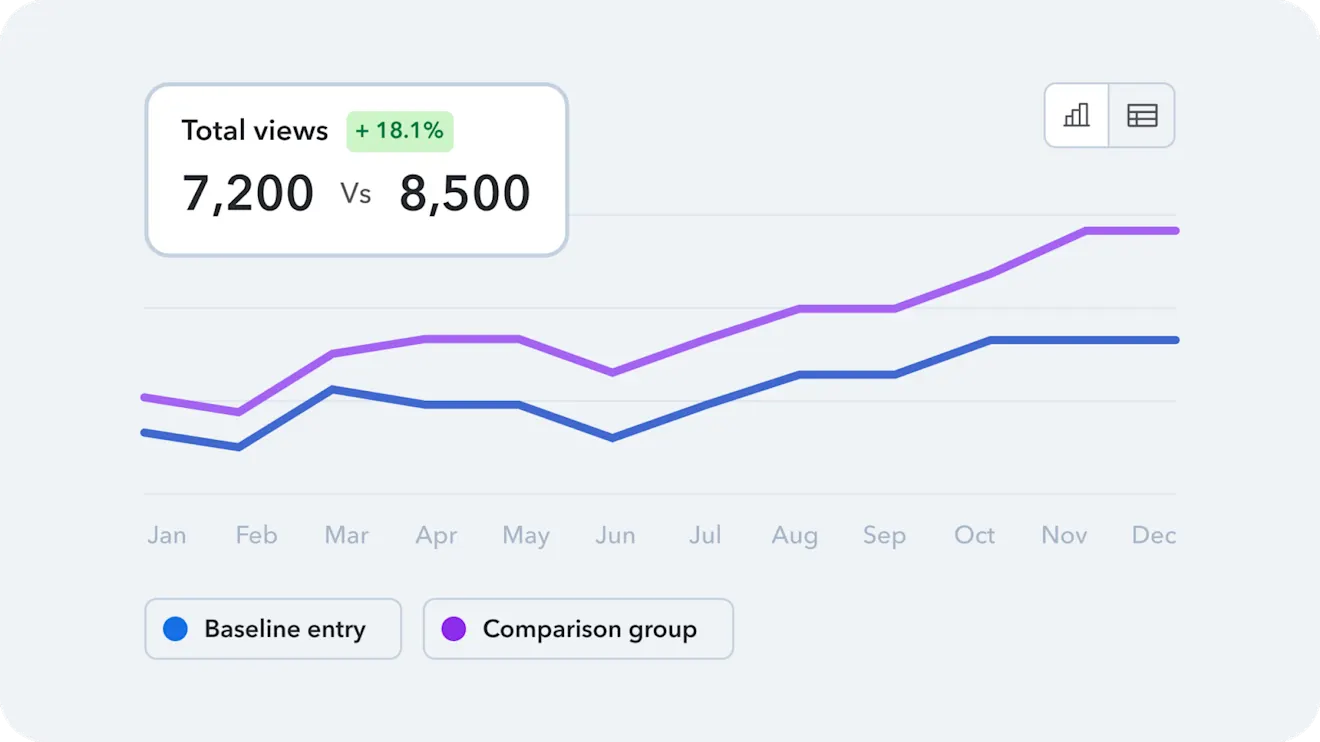
Track against benchmarks
A single number means nothing without context. Benchmarks show how content stacks up, so it’s easy to know if performance is trending up or down.
Compare entry performance against similar content
Set realistic targets based on historical data
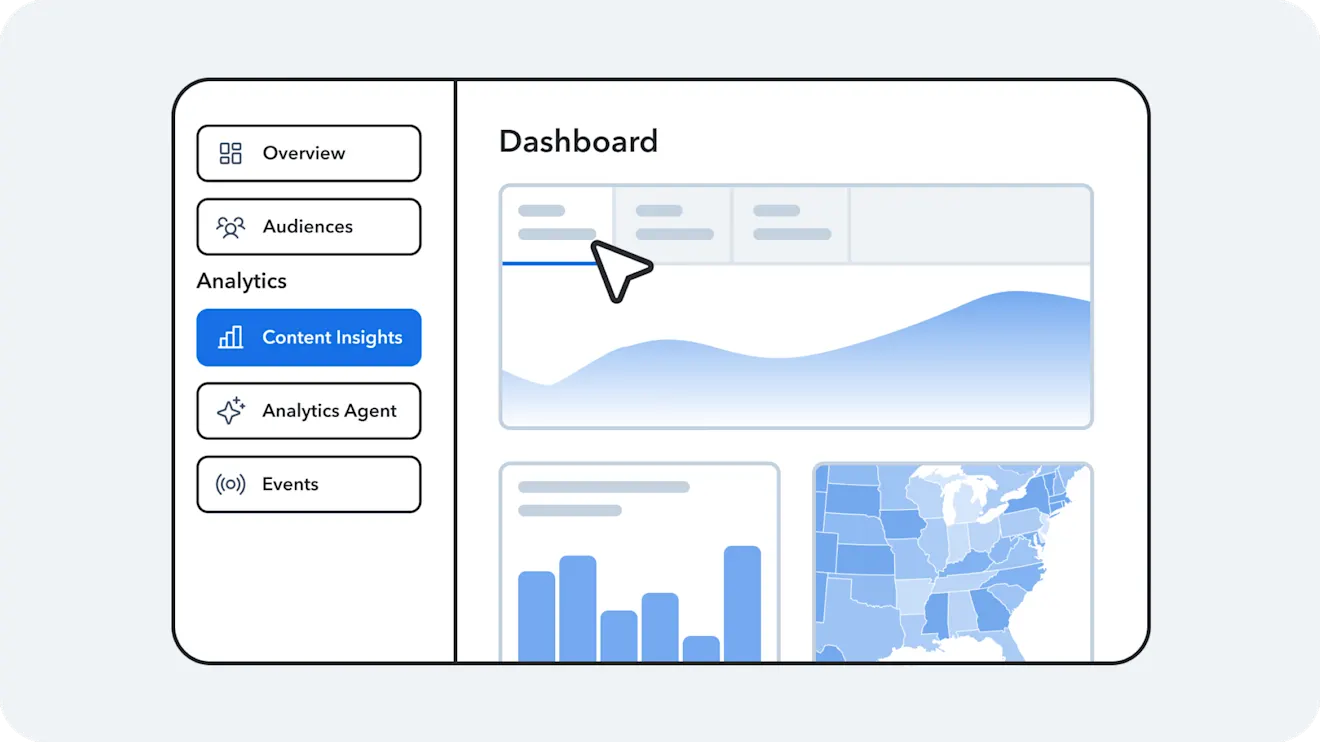
Measure everything from one place
Compare content, campaigns, and personalized experiences across your whole business without switching tools or reconciling separate reports.
Track multiple brands and channels in a single view
Replace fragmented reporting with a single source of truth
Insights for every team

Marketing teams
Keep campaigns on track without digging through endless reports. Content Insights show you what’s working, why, and how to improve it.

Web teams
With analytics built into Contentful, you see insights in the flow of work, so you publish faster and launch sites that get better every time.

Product teams
See how customers interact with your product content. Content Insights flag friction points and identify which experiences drive adoption.

« Les Insights de personnalisation nous ont ouvert un tout nouveau monde de données. Ils agissent comme une loupe sur notre contenu, nous permettant d'approfondir l'analyse de la personnalisation et de la performance des expériences. Nous prenons des décisions plus intelligentes et servons mieux nos clients en conséquence. »
Associate Director, Product Management
Ruggable
Contentful success stories







Plus de façons de réussir avec Contentful
Quels que soient vos objectifs commerciaux, tirez davantage de valeur de vos expériences numériques grâce à notre plateforme.



Analytics resources to get you started